As the final part of our move out of the cloud, we are working on moving 10 petabytes of data out of AWS Simple Storage Service (S3). After exploring different alternatives, we decided to go with Pure Storage FlashBlade solution.

We store different kinds of information on S3, from the attachments customers upload to Basecamp to the Prometheus long-term metrics. On top of that, Pure’s system also provides filesystem-based capabilities, enabling other relevant usages, such as database backup storage. This makes the system a top priority for observability.
Although the system has great reliability, out-of-the-box internal alerting, and autonomous ticket creation, it would also be good to have our metrics and alerts to facilitate problem-solving and ensure any disruptions are prioritized and handled.
For more context on our current Prometheus setup, see how we use Prometheus at 37signals.
Pure OpenMetrics exporter
Pure maintains two OpenMetrics exporters, pure-fb-openmetrics-exporter and pure-fa-openmetrics-exporter. Since we use Pure FlashBlade (fb), this post covers pure-fb-openmetrics-exporter, although overall usage should be similar. The setup is straightforward and requires only binary and basic authentication installation.
Here is a snippet of our Chef recipe that installs it:
pure_api_token = "token" # If you use Chef, your token should come from an encrypted databag. Changed to hardcoded here to simplify
PURE_EXPORTER_VERSION = "1.0.13".freeze # Generally, we use Chef node metadata for version management. Changed to hardcoded to simplify

directory "/opt/pure_exporter/#{PURE_EXPORTER_VERSION}" do
 recursive true
 owner 'pure_exporter'
 group 'pure_exporter'
end

# Avoid recreating under /tmp after reboot if target_binary is already there
target_binary = "/opt/pure_exporter/#{PURE_EXPORTER_VERSION}/pure-fb-openmetrics-exporter"

remote_file "/tmp/pure-fb-openmetrics-exporter-v#{PURE_EXPORTER_VERSION}-linux-amd64.tar.gz" do
 source "https://github.com/PureStorage-OpenConnect/pure-fb-openmetrics-exporter/releases/download/v#{PURE_EXPORTER_VERSION}/pure-fb-openmetrics-exporter-v#{PURE_EXPORTER_VERSION}-linux-amd64.tar.gz"
 not_if { ::File.exist?(target_binary) }
end

archive_file "/tmp/pure-fb-openmetrics-exporter-v#{PURE_EXPORTER_VERSION}-linux-amd64.tar.gz" do
 destination "/tmp/pure-fb-openmetrics-exporter-v#{PURE_EXPORTER_VERSION}"
 action :extract
 not_if { ::File.exist?(target_binary) }
end

execute "copy binary" do
 command "sudo cp /tmp/pure-fb-openmetrics-exporter-v#{PURE_EXPORTER_VERSION}/pure-fb-openmetrics-exporter /opt/pure_exporter/#{PURE_EXPORTER_VERSION}/pure-exporter"
 creates "/opt/pure_exporter/#{PURE_EXPORTER_VERSION}/pure-exporter"
 not_if { ::File.exist?(target_binary) }
end

tokens = <<EOF
main:
 address: purestorage-mgmt.mydomain.com
 api_token: #{pure_api_token['token']}
EOF

file "/opt/pure_exporter/tokens.yml" do
 content tokens
 owner 'pure_exporter'
 group 'pure_exporter'
 sensitive true
end

systemd_unit 'pure-exporter.service' do
 content <<-EOU
 # Caution: Chef managed content. This is a file resource from #{cookbook_name}::#{recipe_name}
 #

 [Unit]
 Description=Pure Exporter
 After=network.target

 [Service]
 Restart=on-failure
 PIDFile=/var/run/pure-exporter.pid
 User=pure_exporter
 Group=pure_exporter
 ExecStart=/opt/pure_exporter/#{PURE_EXPORTER_VERSION}/pure-exporter \
 --tokens=/opt/pure_exporter/tokens.yml

 ExecReload=/bin/kill -HUP $MAINPID
 SyslogIdentifier=pure-exporter

 [Install]
 WantedBy=multi-user.target
 EOU

 action [ :create, :enable, :start ]
 notifies :reload, "service[pure-exporter]"
end

service 'pure-exporter'
Prometheus Job Configuration
The simplest way of ingesting the metrics is to configure a basic Job without any customization:
- job_name: pure_exporter
  metrics_path: /metrics
  static_configs:
  - targets: ['<%= @hostname %>:9491']
    labels:
      environment: 'production'
      job: pure_exporter
  params:
    endpoint: [main] # From the tokens configuration above
For a production-ready setup, we are using a slightly different approach. The exporter supports the usage of specific metric paths to allow for split Prometheus jobs configuration that reduces the overhead of pulling the metrics all at once:
- job_name: pure_exporter_array
  metrics_path: /metrics/array
  static_configs:
  - targets: ['<%= @hostname %>:9491']
    labels:
      environment: 'production'
      job: pure_exporter
  metric_relabel_configs:
  - source_labels: [name]
    target_label: ch
    regex: "([^.]+).*"
    replacement: "$1"
    action: replace
  - source_labels: [name]
    target_label: fb
    regex: "[^.]+\\.([^.]+).*"
    replacement: "$1"
    action: replace
  - source_labels: [name]
    target_label: bay
    regex: "[^.]+\\.[^.]+\\.([^.]+)"
    replacement: "$1"
    action: replace
  params:
    endpoint: [main] # From the tokens configuration above
- job_name: pure_exporter_clients
  metrics_path: /metrics/clients
  static_configs:
  - targets: ['<%= @hostname %>:9491']
    labels:
      environment: 'production'
      job: pure_exporter
  params:
    endpoint: [main] # From the tokens configuration above
- job_name: pure_exporter_usage
  metrics_path: /metrics/usage
  static_configs:
  - targets: ['<%= @hostname %>:9491']
    labels:
      environment: 'production'
      job: pure_exporter
  params:
    endpoint: [main]
- job_name: pure_exporter_policies
  metrics_path: /metrics/policies
  static_configs:
  - targets: ['<%= @hostname %>:9491']
    labels:
      environment: 'production'
      job: pure_exporter
  params:
    endpoint: [main] # From the tokens configuration above
We also configure some metric_relabel_configs to extract labels from name using regex. Those labels help reduce the complexity of queries that aggregate metrics by different components.
Detailed documentation on the available metrics can be found here.
Alerts
Auto Generated Alerts
As I shared earlier, the system has an internal Alerting module that automatically triggers alerts for critical situations and creates tickets. To cover those alerts on the Prometheus side, we added an alerting configuration of our own that relies on the incoming severities:
- alert: PureAlert
  annotations:
    summary: '{{ $labels.summary }}'
    description: '{{ $labels.component_type }} - {{ $labels.component_name }} - {{ $labels.action }} - {{ $labels.kburl }}'
    dashboard: 'https://grafana/your-dashboard'
  expr: purefb_alerts_open{environment="production"} == 1
  for: 1m
We still need to evaluate how the pure-generated alerts will interact with the custom alerts I will cover below, and we might decide to stick to one or the other depending on what we find out.
Hardware
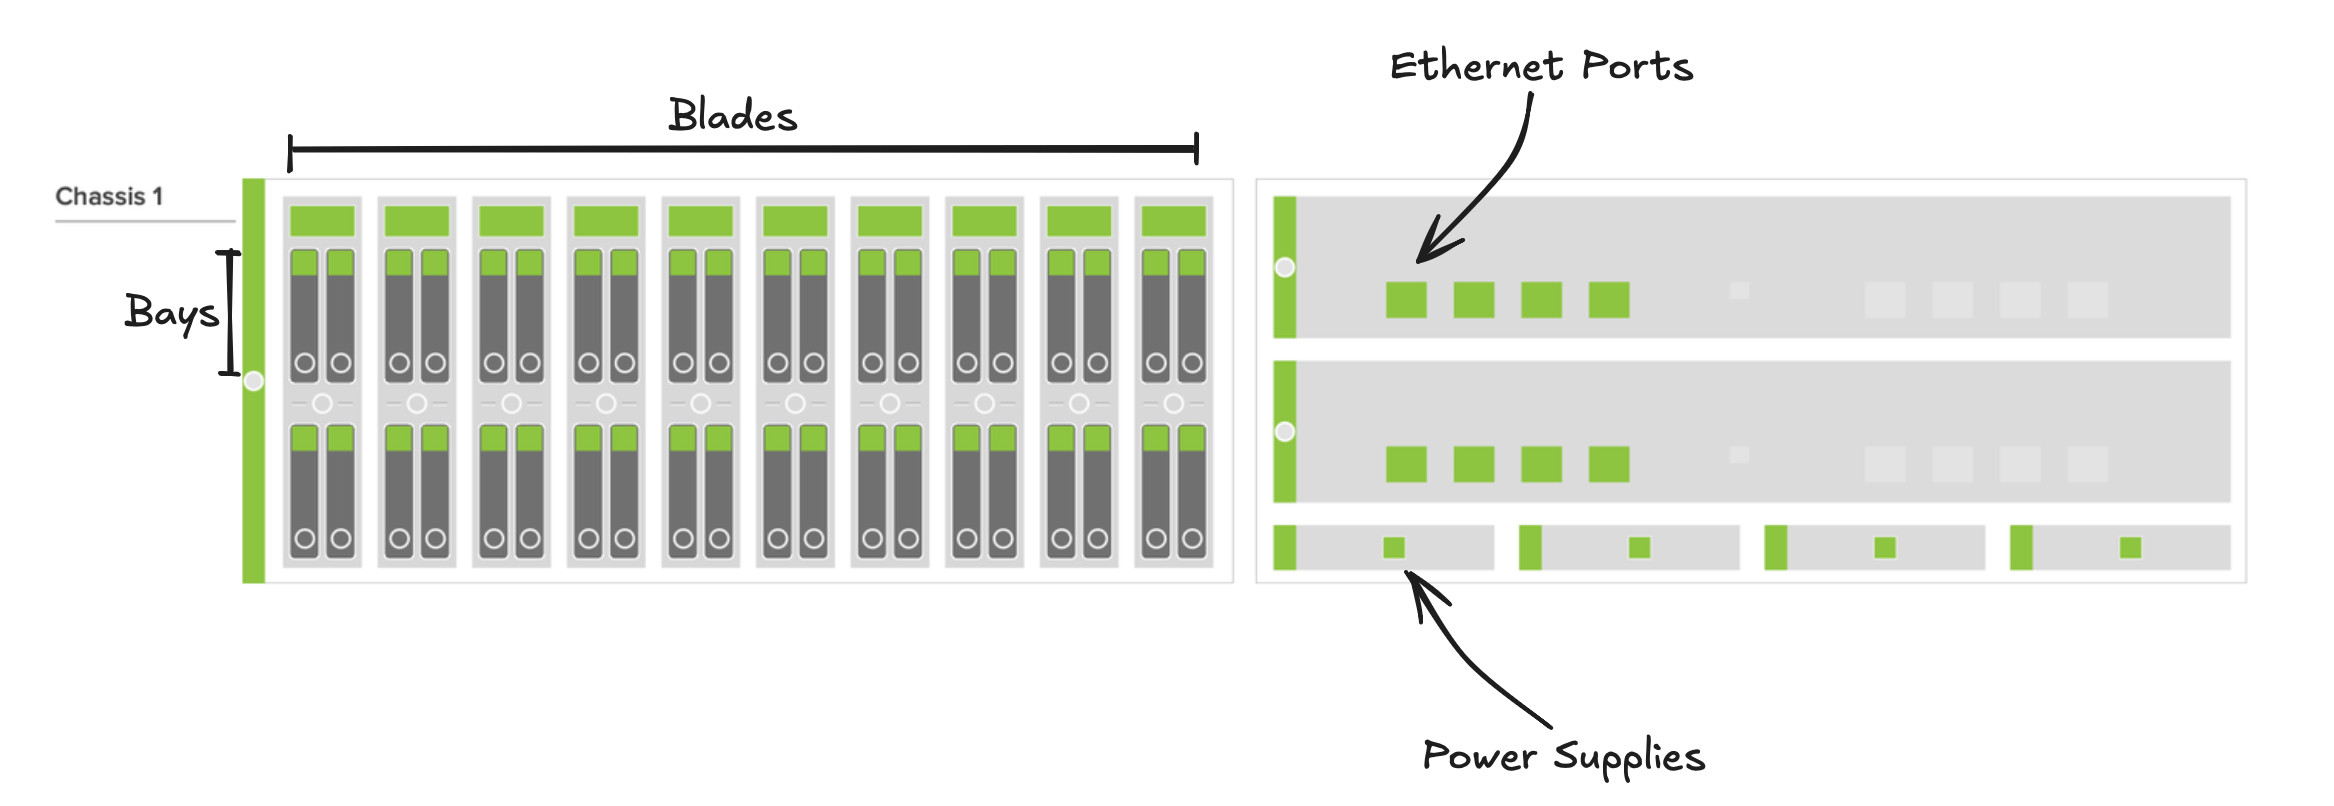
Before I continue, the image below helps visualize how some of the Pure FlashBlade components are physically organized:

Because of Pure’s reliability, most isolated hardware failures do not require the immediate attention of an Ops team member. To cover the most basic hardware failures, we configure an alert that sends a message to the Ops Basecamp 4 project chat:
- alert: PureHardwareFailed
  annotations:
    summary: Hardware {{ $labels.name }} in chassis {{ $labels.ch }} is failed
    description: 'The Pure Storage hardware {{ $labels.name }} in chassis {{ $labels.ch }} is failed'
    dashboard: 'https://grafana/your-dashboard'
  expr: purefb_hardware_health == 0
  for: 1m
  labels:
    severity: chat-notification
We also configure alerts that check for multiple hardware failures of the same type. This doesn’t mean two simultaneous failures will result in a critical state, but it is a fair guardrail for unexpected scenarios. We also expect those situations to be rare, keeping the risk of causing unnecessary noise low.
- alert: PureMultipleHardwareFailed
  annotations:
    summary: Pure chassis {{ $labels.ch }} has {{ $value }} failed {{ $labels.type }}
    description: 'The Pure Storage chassis {{ $labels.ch }} has {{ $value }} failed {{ $labels.type }}, close to the healthy limit of two simultaneous failures. Ensure that the hardware failures are being worked on'
    dashboard: 'https://grafana/your-dashboard'
  expr: count(purefb_hardware_health{type!~"eth|mgmt_port|bay"} == 0) by (ch,type,environment) > 1
  for: 1m
  labels:
    severity: page
 # We are looking for multiple failed bays in the same blade
- alert: PureMultipleBaysFailed
  annotations:
    summary: Pure chassis {{ $labels.ch }} has fb {{ $labels.fb }} with {{ $value }} failed bays
    description: 'The Pure Storage chassis {{ $labels.ch }} has fb {{ $labels.fb }} with {{ $value }} failed bays, close to the healthy limit of two simultaneous failures. Ensure that the hardware failures are being worked on'
    dashboard: 'https://grafana/your-dashboard'
  expr: count(purefb_hardware_health{type="bay"} == 0) by (ch,type,fb,environment) > 1
  for: 1m
  labels:
    severity: page
Finally, we configure high-level alerts for chassis and XFM failures:
- alert: PureChassisFailed
  annotations:
    summary: Chassis {{ $labels.name }} is failed
    description: 'The Pure Storage hardware chassis {{ $labels.name }} is failed'
    dashboard: 'https://grafana/your-dashboard'
  expr: purefb_hardware_health{type="ch"} == 0
  for: 1m
  labels:
    severity: page
- alert: PureXFMFailed
  annotations:
    summary: Xternal Fabric Module {{ $labels.name }} is failed
    description: 'The Pure Storage hardware Xternal fabric module {{ $labels.name }} is failed'
    dashboard: 'https://grafana/your-dashboard'
  expr: purefb_hardware_health{type="xfm"} == 0
  for: 1m
  labels:
  severity: page
Latency
Using the metric purefb_array_performance_latency_usec we can set a threshold for all the different protocols and dimensions (read, write, etc), so we are alerted if any problem causes the latency to go above an expected level.
- alert: PureLatencyHigh
  annotations:
    summary: Pure {{ $labels.dimension }} - {{ $labels.protocol }} latency high
    description: 'Pure {{ $labels.protocol }} latency for dimension {{ $labels.dimension }} is above 100ms'
    dashboard: 'https://grafana/your-dashboard'
  expr: (avg_over_time(purefb_array_performance_latency_usec{protocol="all"}[30m]) * 0.001)
  for: 1m
  labels:
    severity: chat-notification
Saturation
For saturation, we are primarily worried about something unexpected causing excessive use of array space, increasing the risk of hitting the cluster capacity. With that in mind, it’s good to have a simple alert in place, even if we don’t expect it to fire anytime soon:
- alert: PureArraySpace
  annotations:
    summary: Pure Cluster {{ $labels.instance }} available space is expected to be below 10%
    description: 'The array space for pure cluster {{ $labels.instance }} is expected to be below 10% in a month, please investigate and ensure there is no risk of running out of capacity'
    dashboard: 'https://grafana/your-dashboard'
  expr: (predict_linear(purefb_array_space_bytes{space="empty",type="array"}[30d], 730 * 3600)) < (purefb_array_space_bytes{space="capacity",type="array"} * 0.10)
  for: 1m
  labels:
    severity: chat-notification
HTTP
We use BigIp load balancers to front-end the cluster, which means that all the alerts we already had in place for the BigIp HTTP profiles, virtual servers, and pools also cover access to Pure. The solution for each organization on this topic will be different, but it is a good practice to keep an eye on HTTP status codes and throughput.
Grafana Dashboards
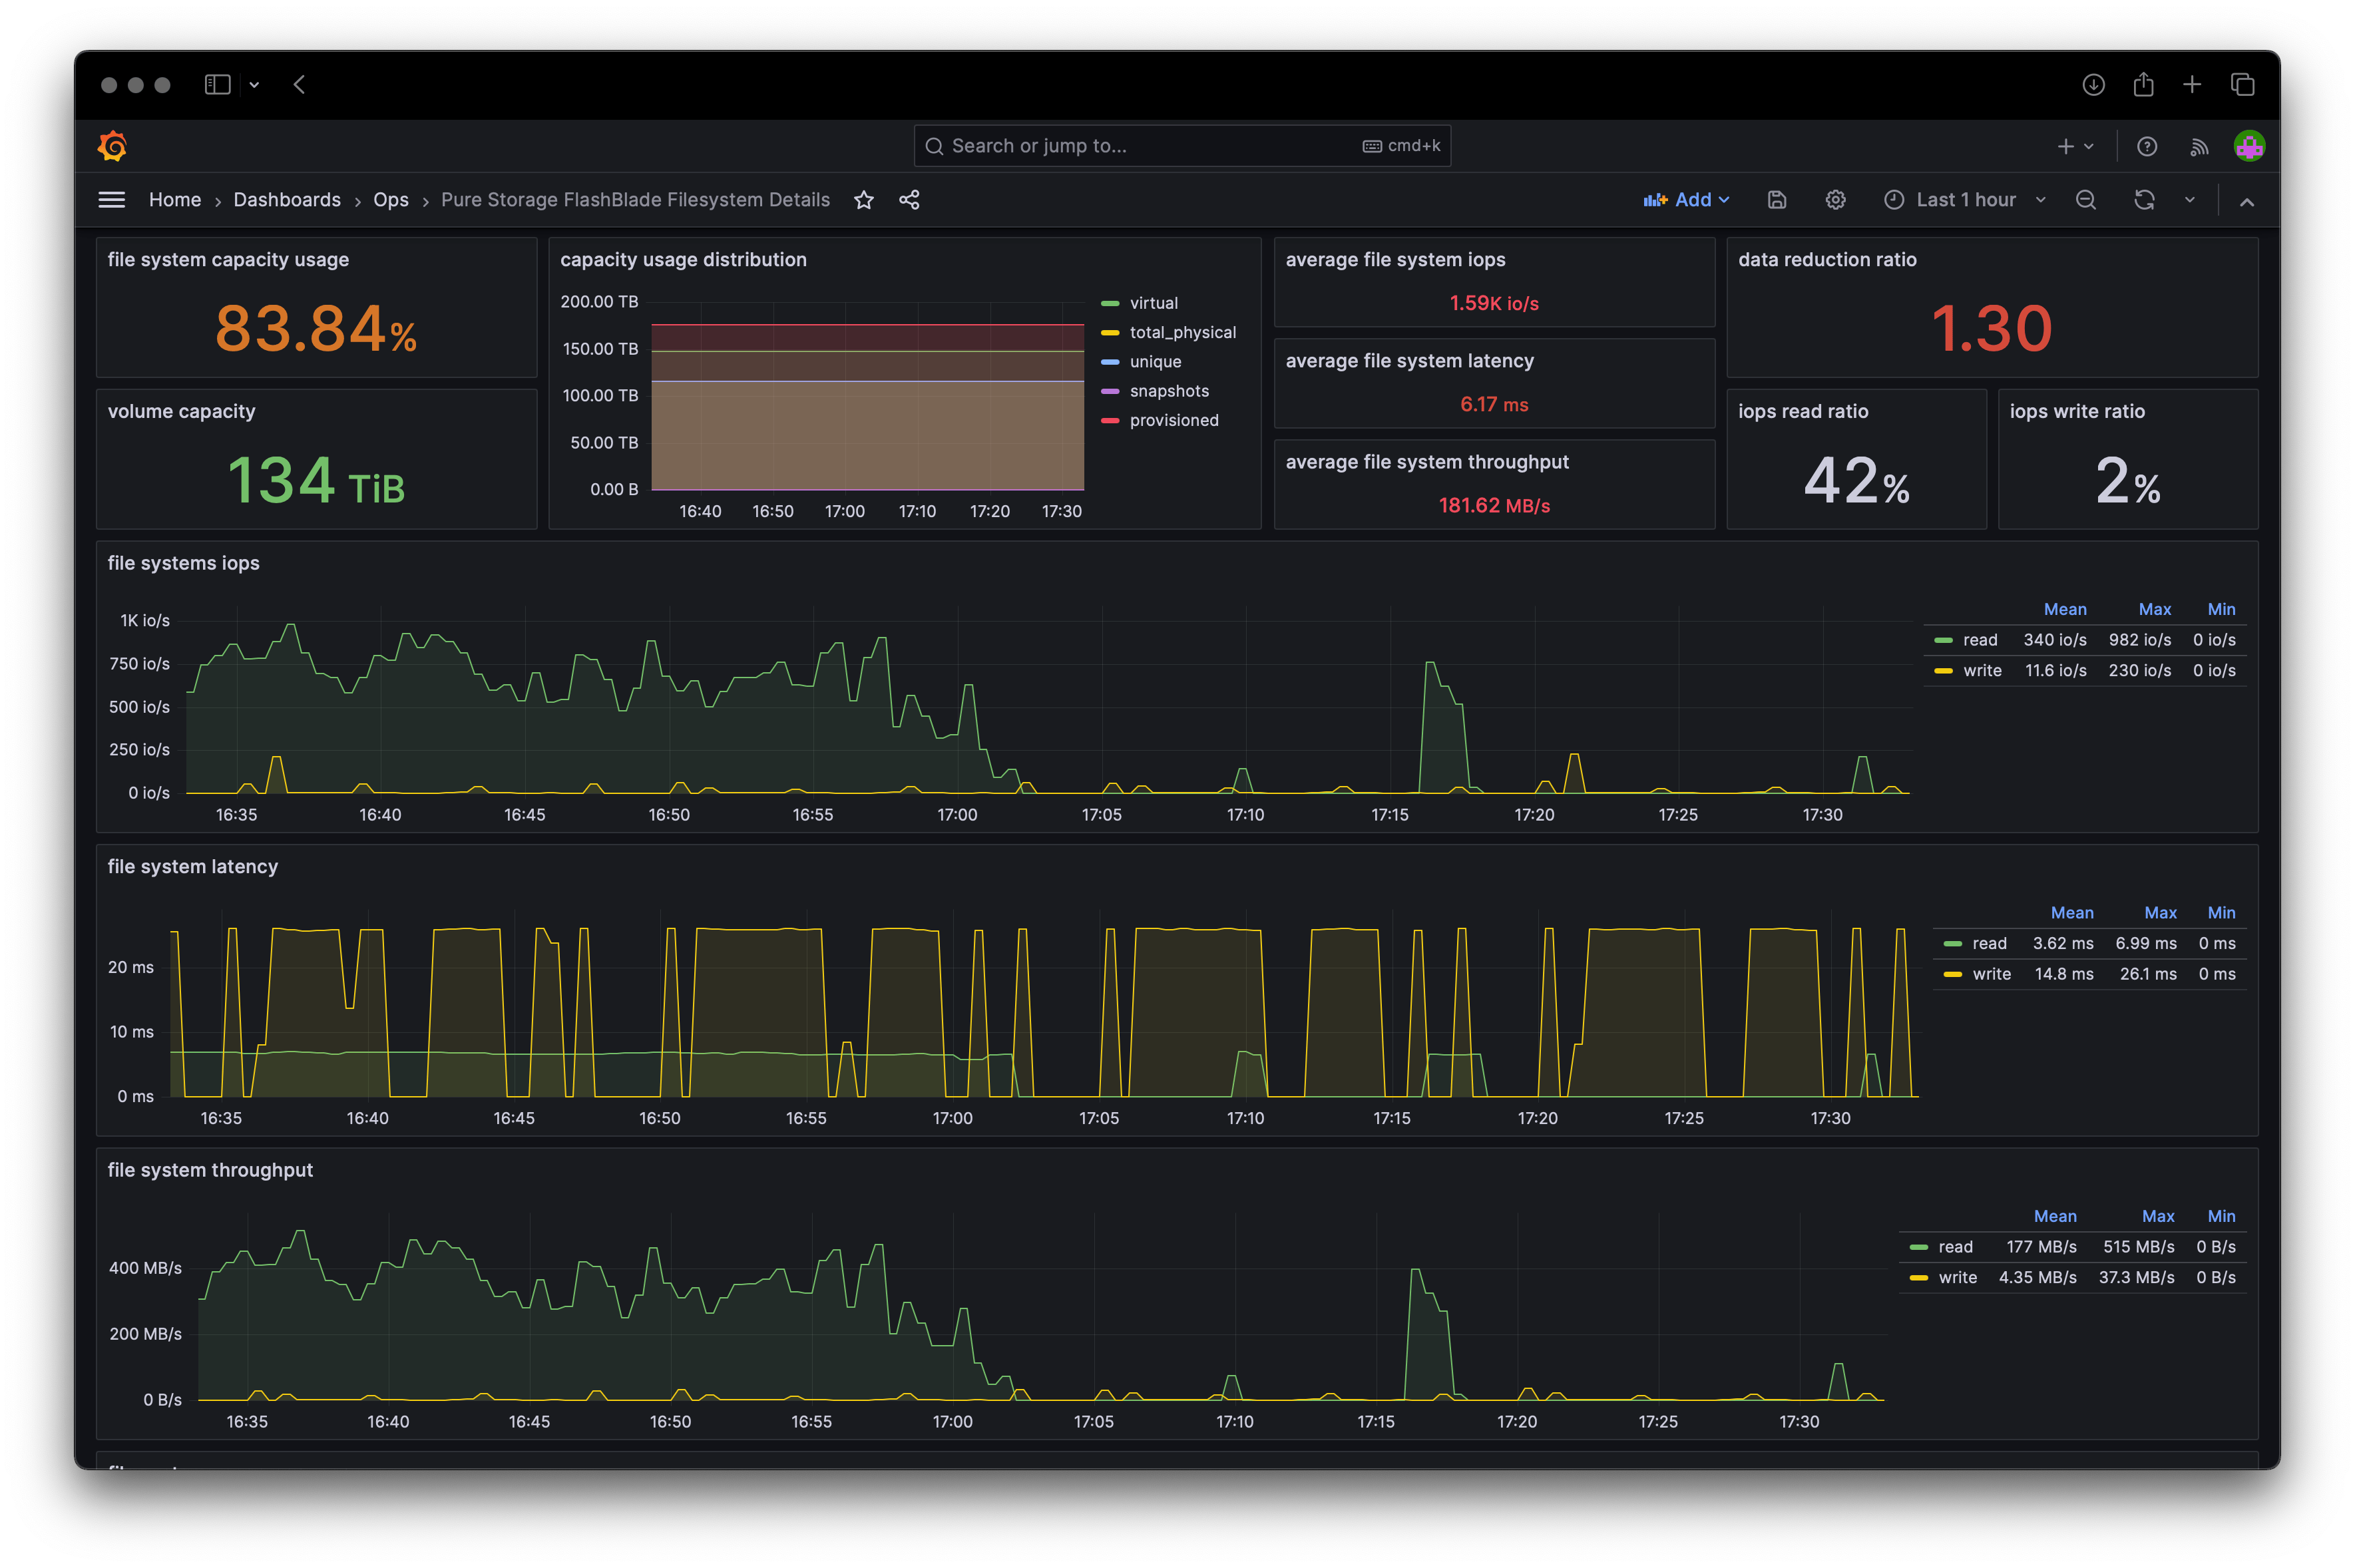
The project’s GitHub repository includes JSON files for Grafana dashboards that are based on the metrics generated by the exporter. With simple adjustments to fit each setup, it’s possible to import them quickly.

Wrapping up
On top of the system’s built-in capabilities, Pure also provides options to integrate their system into well-known tools like Prometheus and Grafana, facilitating the process of managing the cluster the same way we manage everything else. I hope this post helps any other team interested in working with them better understand the effort involved.
Thanks for reading!
Sign up to get posts via email,
or grab the RSS feed.
