
The Ops team at 37signals has successfully brought our apps off the cloud and back home. In addition to moving the apps, we must ensure proper observability is available in our data centers.
Robust and detailed observability is mission-critical. It directly impacts how quickly we respond to and fix outages. It focuses our attention and gives us up-to-date information when debugging an ongoing incident.
In this blog post, I will share more about how we use Prometheus to properly ingest, store, and alert based on metrics in a way we can confidently migrate and manage infrastructure and applications on-prem. It’s the first post in the On-prem observability series.
Prometheus
Prometheus is the most well-known open-source monitoring tool. It was the second project to successfully graduate on CNCF and is widely used across the industry. Initially written by the SoundCloud engineering team, it was open-sourced and joined CNCF in 2016.
It relies on an internal component named TSDB to store all the metrics in the time series format. TSDB saves the data on disk in blocks, correlating the data points with its metadata (the metric name, its labels, etc). I recommend reading the Prometheus TSDB blog post series by Ganesh Vernekar, if you wish to go deeper into how TSDB works.
Prometheus offers a Domain Specific Language (DSL) to query metrics called PromQL. It was designed to work with TSDB to filter and efficiently transform the metrics Prometheus scrapes.
Architecture
Here’s an illustration of the architecture described in the coming sections1:
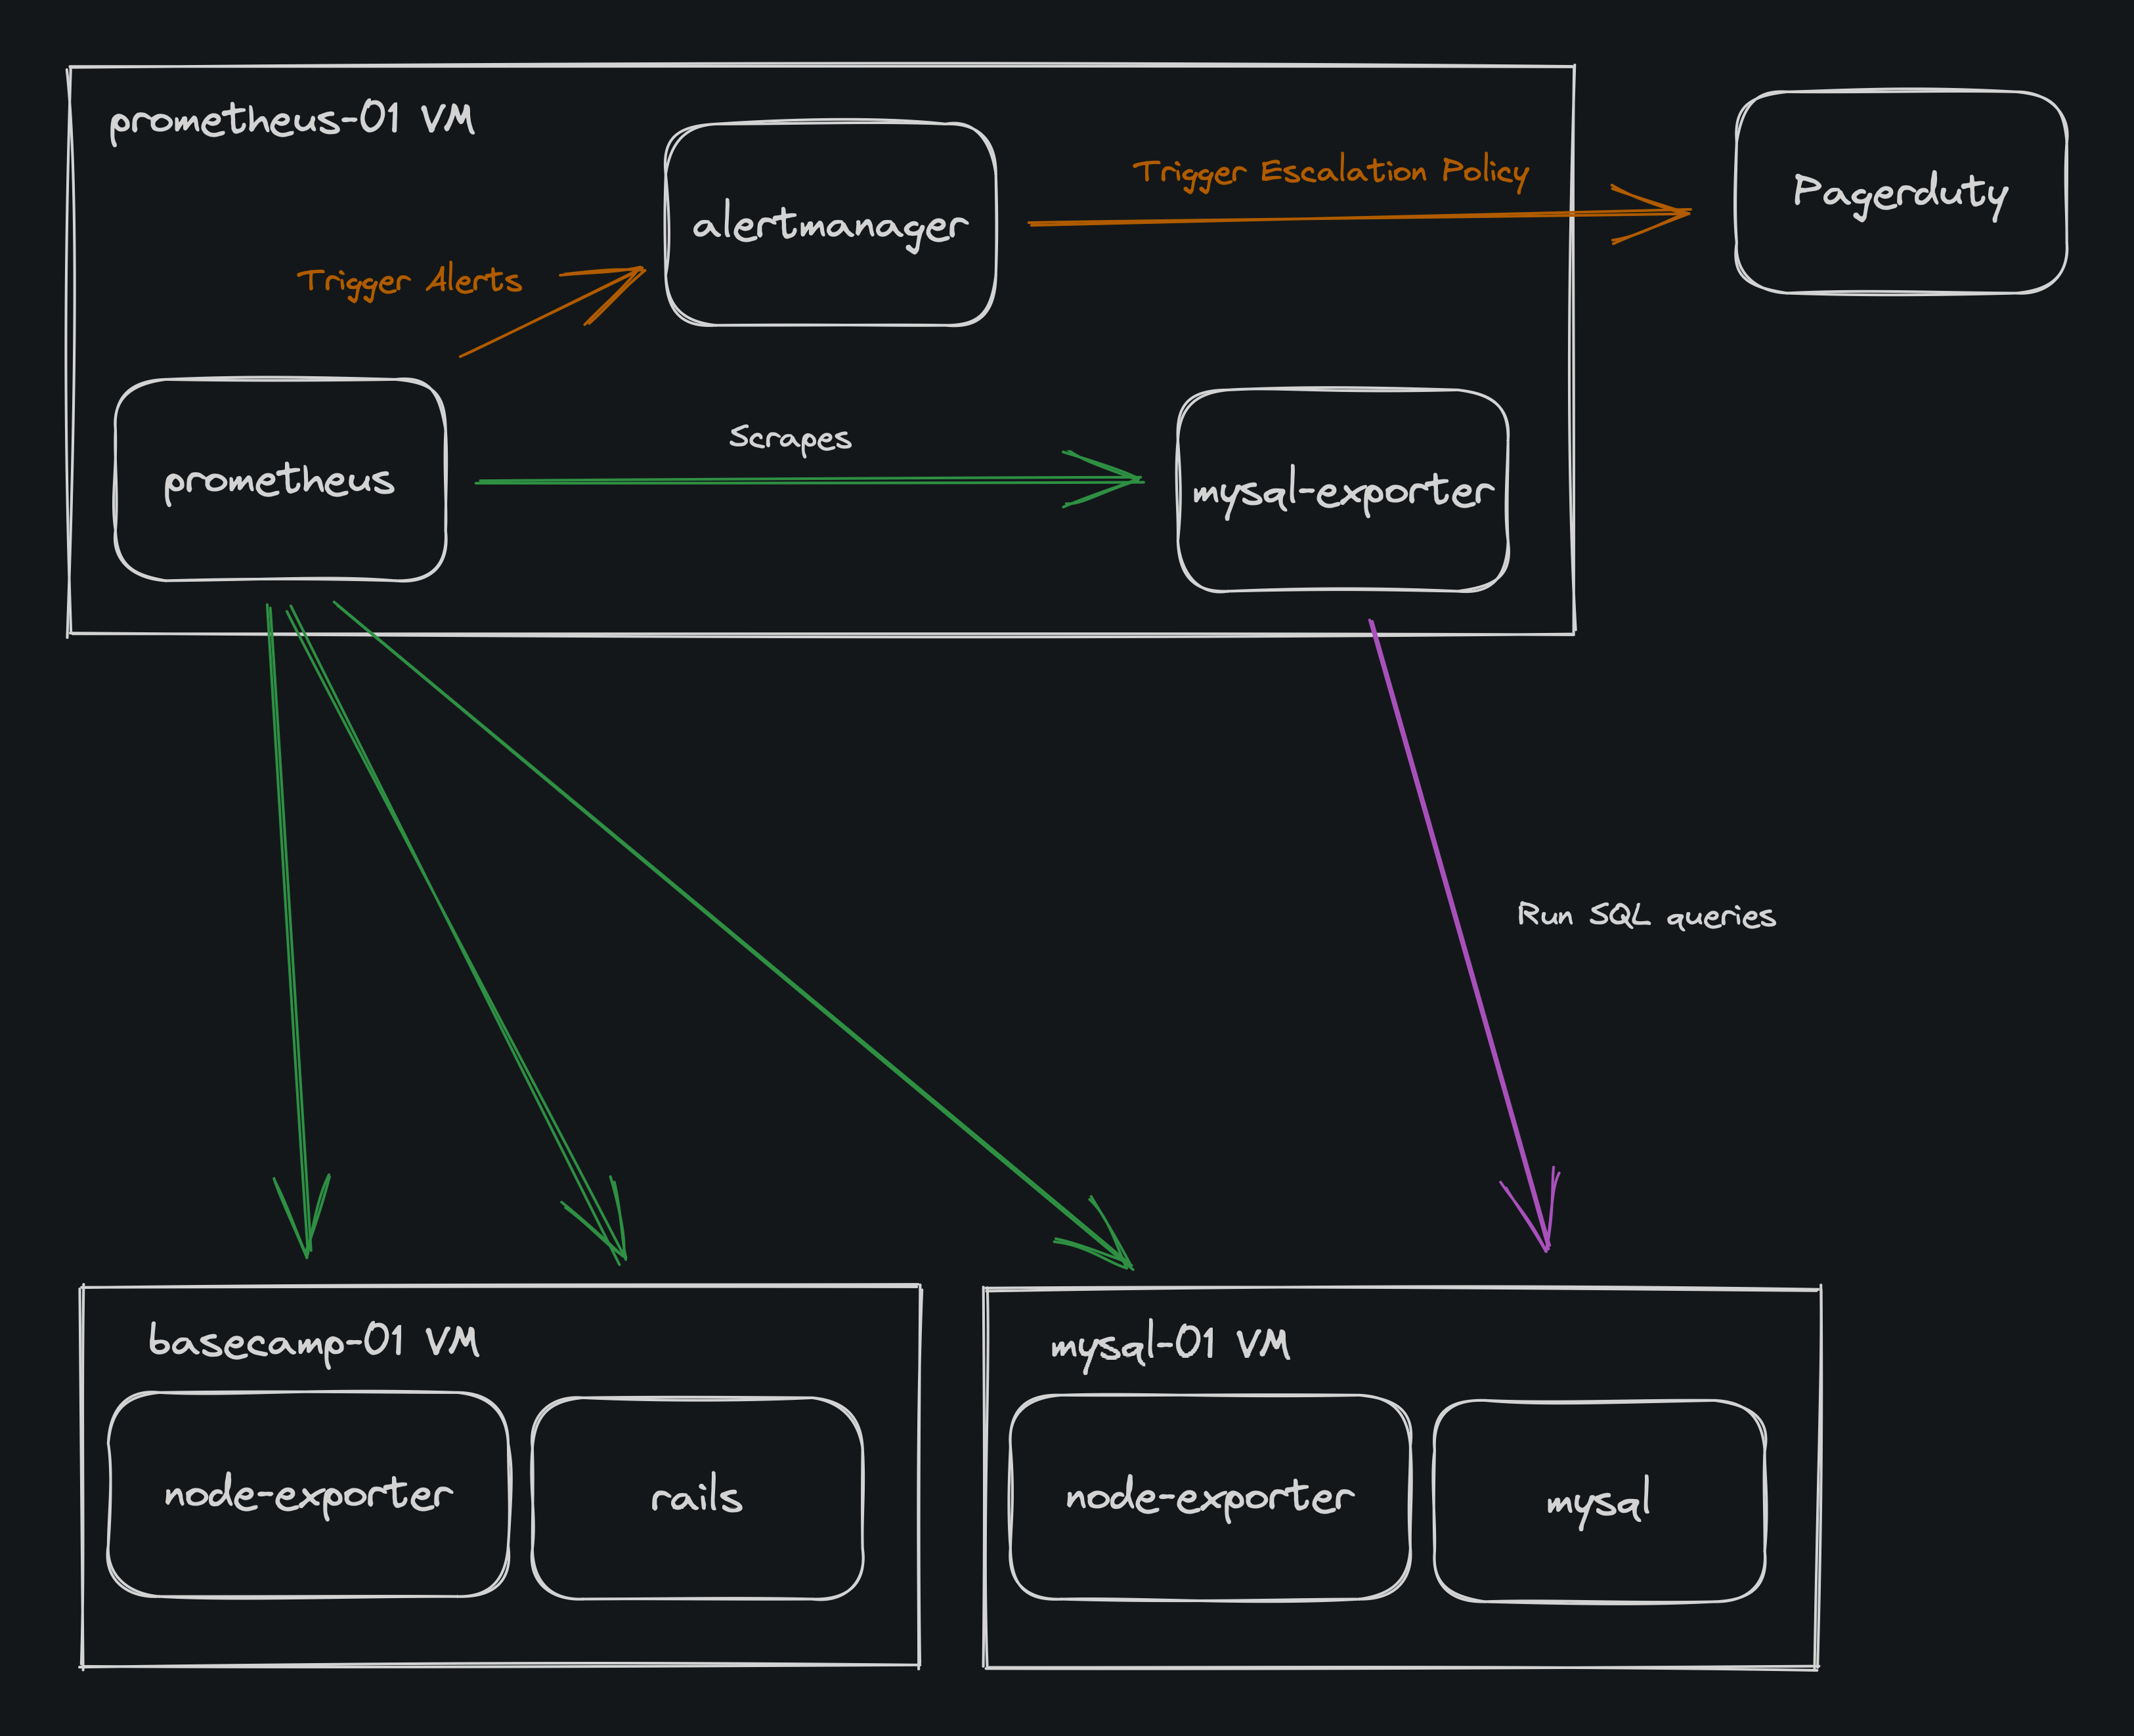
Metrics generation
There are three main ways of generating Prometheus-formatted metrics:
- The more convenient way is enabling the metrics exposure in a framework/application that already supports it2.
- It’s also possible to use the open-source Prometheus libraries for different programming languages to instrument the application and expose the metrics needed.
- The last option would be to use or build an open-source Prometheus exporter. This is usually selected when neither of the above options is possible.
An exporter is an application that generates the metrics by collecting the needed data in a way supported by the target application/system. For example, one could use SQL queries to build a mysql_exporter and generate metrics from MySQL using a standard DB connection.
We rely on yabeda and its adapters to instrument our Ruby on Rails apps and also run a bunch of Prometheus exporters so we can have a more comprehensive view of our infrastructure. An extensive list of exporters available can be found here.
How we run Prometheus
The Prometheus ecosystem supports a lot of different approaches for running it.
Generally, we run stateful infrastructure tools on top of KVM virtual machines. We heavily rely on Chef to manage our hosts and guests, including those running Prometheus.
To accomplish this, we built an internal Chef Cookbook responsible for installing, configuring, and running Prometheus. It creates the users and groups needed, downloads and copies the binary to the desired location, configures Prometheus and sets up the systemd service.
On top of that, it also configures and runs some Prometheus exporters that export data in a one-to-many setup, like the blackbox_exporter.
Here’s an example systemd service definition similar to what we use:
 [Unit]
 Description=Prometheus
 After=network.target
 [Service]
 Restart=on-failure
 User=prometheus
 Group=prometheus
 ExecStart=/usr/local/bin/prometheus \
 --storage.tsdb.path=/var/lib/prometheus \
 --storage.tsdb.retention.time=30d \
 --storage.tsdb.retention.size=0 \
 --web.listen-address=0.0.0.0:9090 \
 --web.external-url=https://prometheus.domain.com \
 --storage.tsdb.min-block-duration=2h \
 --storage.tsdb.max-block-duration=2h \
 --config.file=/etc/prometheus/prometheus.yml
 ReadWritePaths=/var/lib/prometheus
 SyslogIdentifier=prometheus
 Restart=always
 [Install]
 WantedBy=multi-user.target
You may notice that we configure a short retention time here because we also use Thanos. It allows us to keep a shorter retention time on Prometheus and store long-term data in an object store backend.
Metrics collection
Prometheus uses a pull-based approach for metrics collection3. This means that it reaches the applications and exporters to read the data generated by them instead of processing data sent in. This process is called scraping and is configured as part of setting up the instance. There are several different service discovery mechanisms available.
Since we use Chef to manage most of our infrastructure, we utilize its ability to search for nodes based on different criteria to provide this information to Prometheus using the file_sd service discovery configuration.
Here’s a sample ruby code to illustrate this:
# Using Chef::DSL::DataQuery
# Some code omitted for simplicity
targets = []
nodes = search(:node, "fqdn:prefix*").sort
nodes.each do |node|
 targets << {
 target: "#{node.name}:9090", # We need to specify a port to be scraped
 exporter: "exporter1",
 labels: {
 labelA: "valueA",
 labelB: "valueB",
 job: "exporter1",
 datacenter: "dc1",
 },
 }
end

template '/etc/prometheus/file_sd/targets.json' do
 source 'chef_nodes.json.erb'
 variables(
 targets: targets
 )
end
And the chef_nodes.json.erb template file:
[
 <% @targets.each_with_index do |target, index| %>
 {
 "targets": [
 "<%= target[:target] %>"
 ],
 "labels": <%= target[:labels].to_json %>
 }<% if index == @targets.count - 1 %><% else %>,<% end %>
 <% end %>
]
With an approach like this, new nodes for our apps covered by the search criteria are only a Chef converge away from being scraped by Prometheus. We can also configure many aspects of how the scrape process should work using the main configuration file, for example, scrape_interval and scrape_timeout. For more details, look at the official documentation.
Alerting
Two parts are commonly confused: Alert and Record rules evaluation and alert propagation.
Alert and Record rules evaluation
The primary Prometheus process handles this part, and one of the main reasons is to avoid putting networking and other faulty parts between the data and the alerts/rules evaluator. Record and Alert rules are pretty similar, the difference being that one is used to create a new time-series based on an expression4 and the other to trigger an alert.
We have been building our alerts configuration since the day we first deployed Prometheus, and it’s usually a continuous effort as we need to add alerts for new pieces of infrastructure and adjust the sensibility of the ones that already exist to avoid generating unnecessary noise for the On-call engineers and the rest of the team.
Here’s an example alert that we use to let us know when a systemd service fails:
groups:
- name: Node Resource Alerts
 rules:
 - alert: SystemdServiceCrashed
 annotations:
 summary: Systemd service {{ $labels.name }} failed on {{ $labels.instance }}
 description: Systemd service {{ $labels.name }} failed on {{ $labels.instance }}
 expr: node_systemd_unit_state{state="failed"} == 1
 for: 0m
 labels:
 severity: critical
The node_systemd_unit_state is a metric generated by the node_exporter.
Note that we have only talked about triggering an alert so far, and that’s exactly as far as Prometheus’s process responsibilities go.
Alert propagation with Alertmanager
Alert grouping, silencing, and integrations between the Prometheus environment with third-party tools5 are responsibilities of the Alertmanager. This is the part that engineers mostly interact with once Prometheus triggers an alert.
At 37signals, we rely on Alertmanager to handle and send each alert and severity to PagerDuty (usually the ones requiring human intervention) and Dash (our internal Observability tool). Dash also sends some of those alerts to internal Campfires in Basecamp.
route:
 group_by: ['alertname', 'prometheus_cluster', 'environment']
 receiver: web.hook
 repeat_interval: 5m
 routes:
 - match:
 severity: critical
 receiver: pagerduty
receivers:
 - name: web.hook
 webhook_configs:
 - url: #{dash_endpoint}
 - name: pagerduty
 pagerduty_configs:
 - service_key: #{pd_service_key}
 webhook_configs:
 - url: #{dash_endpoint}
As we can see, the SystemdServiceCrashed alert described above would be sent to PagerDuty, because its severity is critical.
Alertmanager also supports the ability to silence alerts. That can reduce the noise while something is worked on, an alert needs adjustment, etc. This model also avoids an alert being silenced forever, as we need to define an expiration date.
Need to silence an alert forever? Then you should remove or filter it instead!
Scalability and limitations
Prometheus is a stateful system that can grow in resource usage as you ingest metrics from all applications and pieces of your infrastructure. Put different clusters, data centers, and environments on top of that, and you can end up with a pretty big instance.
While vertical scaling will do the trick in the beginning, at some point, we experienced some problems, like Prometheus becoming a single point of failure for metrics, taking too much time to start up, and requiring a lot of memory.
We also felt running multiple Prometheus instances with a pair of them on each data center would be better.
To solve some of those problems, we deployed Thanos. I opted to keep this subject to a future post to avoid overextending this one.
Wrapping up
Since moving back to on-prem became the top priority in our team a couple of months ago, we have been heads down into defining the building blocks that would allow us to efficiently manage all those applications and the underlying infrastructure in a way that ensures the reliability our customers expect.
Prometheus is a phenomenal tool for metrics, and the tremendous open-source community around the tool greatly helps ingest data from different sources. While it does have its limitations, we can extend its capabilities by using it alongside other tools like Thanos.
Footnotes
-
I purposely removed Thanos and Grafana from the architecture as those will be covered by future posts and I don’t want confuse the reader. ↩
-
For example, Java’s SpringBoot ships with Prometheus metrics out of the box. It’s common to see Prometheus metrics exposed by most CNCF open-source tools. ↩
-
It also supports a push-based approach to work with short-lived processes, although a pull-based scrape is recommended. ↩
-
For example, a time series that is the rate of all HTTP requests across all your instances instead of a per-instance total metric. ↩
-
It’s possible to integrate Alertmanager with a bunch of third-party tools like Slack, PagerDuty, VictorOps, OpsGenie, and others. ↩
Sign up to get posts via email,
or grab the RSS feed.