
We use Prometheus metrics quite heavily at 37signals nowadays. They’re used to monitor a variety of components in our infrastructure, such as MySQL, Redis and the servers hosting our applications. My colleague, Victor, previously wrote in detail about Prometheus metrics at 37signals.
We also use Prometheus metrics to monitor our Rails apps. The metrics can tell us a lot, including:
- request rates and latencies
- how many background jobs have succeeded or failed
- how YJIT is performing
In production, we run multiple processes on multiple containers and on multiple servers so we need a solution to aggregate and collate those metrics to form one overall picture.
This post will cover how we export metrics from our Rails apps, including how we export them from Docker containers managed via Kamal.
Yabeda
Prometheus scrapes metrics from our Rails servers and so requires the app to serve, or export, those metrics. To help us do that we use Yabeda. Yabeda is a collection of Ruby gems from Evil Martians that makes it easy to export Prometheus metrics from a Rails app. Yabeda Prometheus supports aggregating metrics from individual processes, so we only need to scrape the metrics at the container level.
Once set up with yabeda-prometheus, yabeda-puma-plugin, and yabeda-rails metrics can be viewed by running:
$ curl localhost:9394/metrics

# HELP rails_requests_total Multiprocess metric
# TYPE rails_requests_total counter
rails_requests_total{action="show",controller="Boxes::ImboxController",format="html",method="get",status="500"} 1
# HELP rails_view_runtime_seconds Multiprocess metric
# TYPE rails_view_runtime_seconds histogram
rails_view_runtime_seconds_bucket{action="show",controller="Boxes::ImboxController",format="html",le="+Inf",method="get",status="500"} 1
rails_view_runtime_seconds_bucket{action="show",controller="Boxes::ImboxController",format="html",le="0.005",method="get",status="500"} 1
...
Serving metrics on port 9394 and at the /metrics path is typical for Prometheus Ruby clients.
Performance
We ran into some performance problems with the yabeda-prometheus gem, which struggled with our large number of metrics. To fix this we switched over to use yabeda-prometheus-mmap based on the more performant prometheus-client-mmap from the team at GitLab.
One pitfall which we ran into is noted in the prometheus-client-mmap README:
PID cardinality
In multiprocess setup e.g. running under Unicorn or Puma, having worker process restart often can lead to performance problems when processing metric files. By default each process using Prometheus metrics will create a set of files based on that process PID. With high worker churn this will lead to creation of thousands of files and in turn will cause very noticeable slowdown when displaying metrics
To reduce this problem, a surrogate process id can be used. Set of all such IDs needs have low cardinality, and each process id must be unique among all running process.
What this means is that if you use Unicorn, Puma, or even Resque it’s important to follow the instructions on configuring a PID provider. We do that like so:
# config/initializes/yabeda.rb

require "prometheus/client/support/puma"

Prometheus::Client.configuration.pid_provider = Prometheus::Client::Support::Puma.method(:worker_pid_provider)
Production
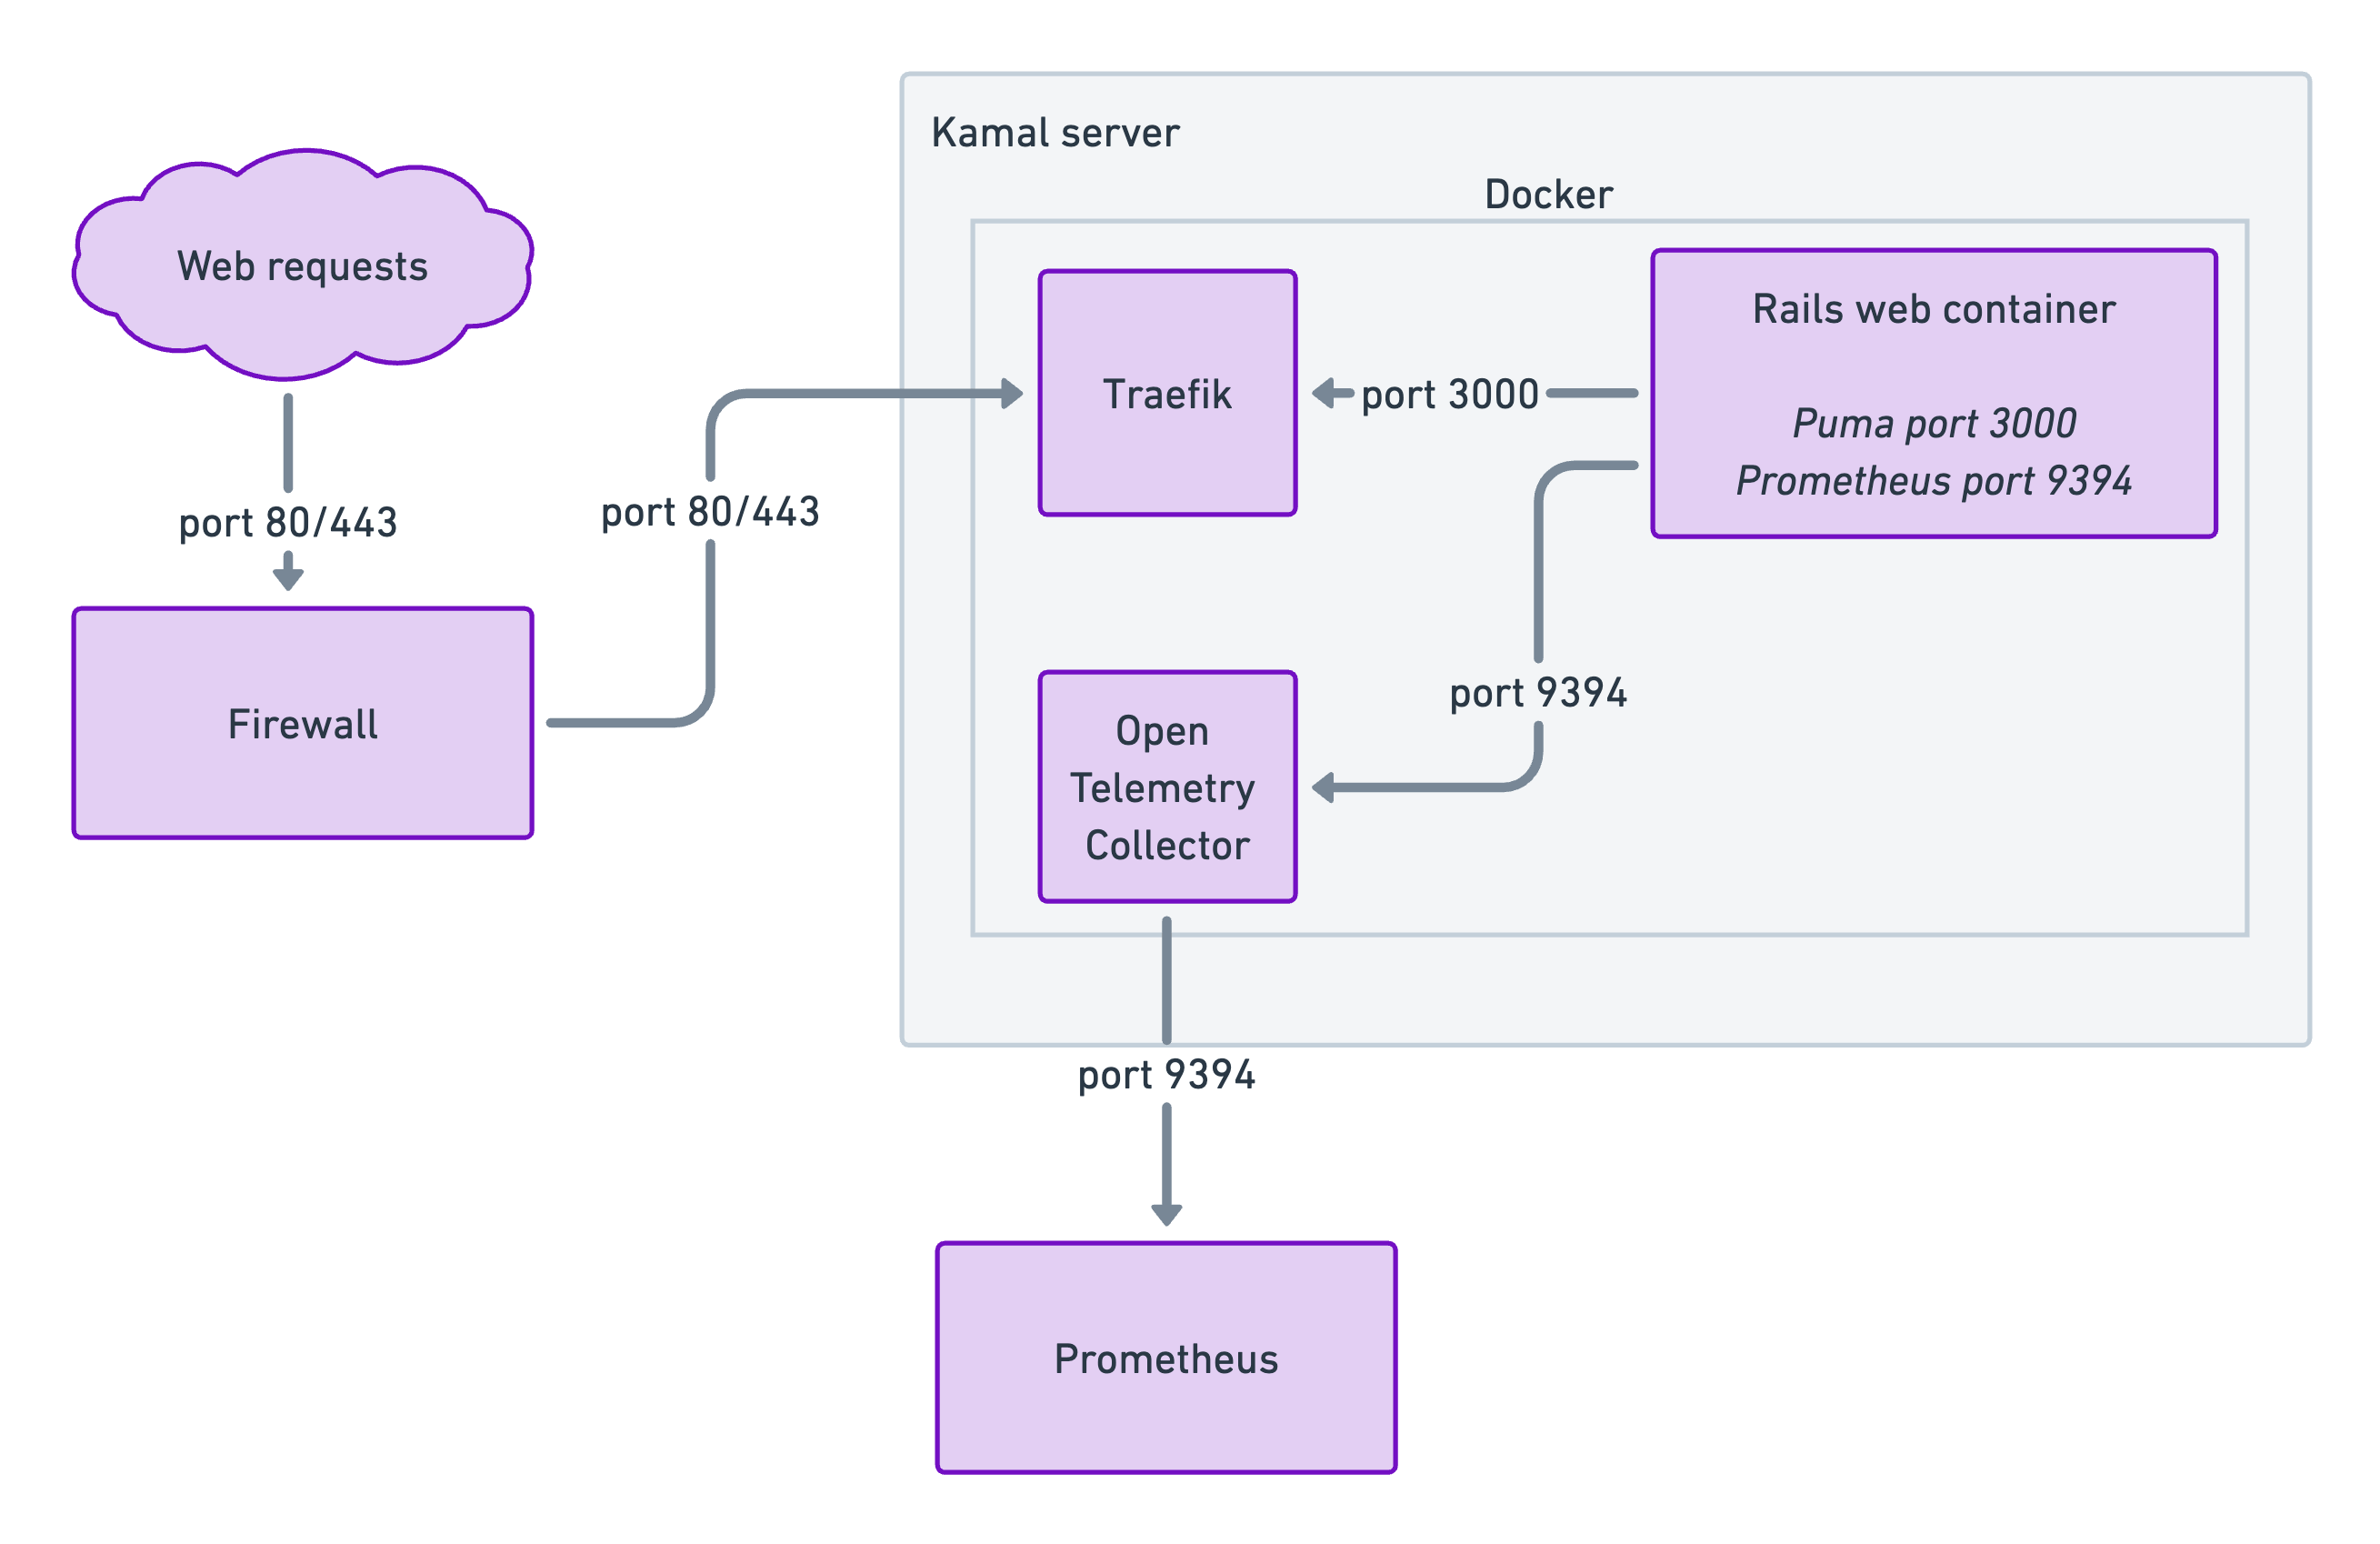
Once we were happy with the metrics being served by our app, we needed to think about how to expose a single endpoint on each server for Prometheus to scrape, when we can have multiple Docker containers running on a single host.
To do that we’re using OpenTelemetry Collector as a Kamal accessory. OpenTelemetry Collector scrapes metrics from containers, on the Docker internal network, and exposes them in one external location, port 9394.
- each container exposes port 9394, serving metrics
- OpenTelemetry Collector uses Docker service discovery to locate these containers and scrape metrics
- the Collector then collates and exposes those metrics on port 9394 and labels them with the container name
Finally, Prometheus scrapes and stores those metrics, allowing querying metrics across the system.
Here’s a simplified diagram showing it works:
The benefits of this system:
- a single endpoint per host to scrape metrics from
- it avoids port conflicts with multiple containers on a single host
- it avoids complex Traefik configuration to get it to proxy metrics
The configuration is fairly simple:
# Kamal
# config/deploy.yml

...

accessories:
  otel_collector:
    image: otel/opentelemetry-collector:0.100.0
    port: 9394
    files:
      - config/otel_collector.yml:/etc/otelcol/config.yaml
    volumes:
      - /var/run/docker.sock:/var/run/docker.sock
    options:
      user: 0 # if you run Docker as root
    roles:
      - web
# OpenTelemetry Collector
# config/otel_collector.yml

receivers:
  prometheus:
    config:
      scrape_configs:
        - job_name: "otel-collector"
          scrape_interval: 5s
          docker_sd_configs:
            - host: unix:///var/run/docker.sock
              refresh_interval: 10s
          relabel_configs:
            # Only keep targets with role label as 'web' or 'jobs'
            - source_labels: [__meta_docker_container_label_role]
              regex: (web|jobs)
              action: keep
            # Only scrape port 9394
            - source_labels: [__address__]
              regex: (.*):9394
              action: keep
            # Add container label
            - source_labels: [__meta_docker_container_label_role, __meta_docker_container_id]
              separator: "_"
              target_label: container

exporters:
  prometheus:
    endpoint: 0.0.0.0:9394

service:
  telemetry:
    logs:
      level: "debug"
  pipelines:
    metrics:
      receivers: [prometheus]
      exporters: [prometheus]
I’ve created a repository showing how these pieces fit together.
Check the commits for more detail and the Kamal documentation to see how to manage accessories.
Questions?
I hope you find this post useful and would be interested in hearing from you if you do. Have a question, comment or idea? Get in touch at lewis@hey.com or x.com/lewispb
Sign up to get posts via email,
or grab the RSS feed.